Streamlitの新しいConnections機能とインタラクティブなPlotlyマップでアプリを強化する
Streamlitの新しいConnections機能とインタラクティブなPlotlyマップでアプリを強化する
Aeroa:空気品質の可視化のためのアプリ

はじめに
Streamlitは最近、この記事が書かれている時点で、新機能「st.experimental_connection」を発表しました。私はこの機能を使ってどのように動作するかを理解することにとても興味を持ちました。詳細は公式ドキュメントにあります。

では、この新機能とは何か、それを使って何ができるのでしょうか?この機能を介して、新しいデータストアやAPIへの接続を作成したり、既存の接続を返したりすることができます。また、認証情報やシークレットなど、さまざまなソースから取得される接続に対して、クレデンシャル、シークレットなどの設定オプションも豊富に用意されています。私に言わせれば、こういったことについては、Streamlitと独自のコード(必要な時間)で何かを構築することもできますが、今ではStreamlitが組み込みの機能でより優れた能力を提供してくれます。
接続クラスの詳細
では、この機能で使用されるメインクラスの詳細を見てみましょう。Streamlitでは、独自の接続クラスを作成し、アプリ内で呼び出すことができます。SQLやSnowflakeのためのいくつかの組み込みの接続クラスもすでに用意されています。以下はSQLの例です。
import streamlit as stconn = st.experimental_connection("sql")より複雑な操作もできますが、次の具体的な例では詳しく説明します。
- シミュレーション101:伝導熱伝達
- 「ChatGPTを使用して完全な製品を作成するために学んだ7つの教訓」
- ダイナミックAIプロジェクト見積もり’ (Dainamikku AI purojekuto mitsumori)
独自の接続クラスの作成
Streamlitは、独自の接続クラスを作成するためのハッカソンを発表しました。時間の制約があるため、私は参加してシンプルなアプリを作成することにしました。このアプリは、OpenAQというオープンなAPIが提供する空気品質と気象データを使用します。このAPIは、特定の地域に設置されたセンサーに基づいて、ほとんどの国に対していくつかのデータを提供します。
上記のAPIを使用するためには、新しい接続クラスを作成する必要があります。このクラスには、requestsライブラリの新しいセッション、国のデータを取得するためのクエリ(少しカスタムコードが必要です)、選択した国の具体的なデータを取得するためのメインクエリなどが含まれます。以下の部分は「connection.py」というファイルに含まれます。
from streamlit.connections import ExperimentalBaseConnectionimport requestsimport streamlit as stclass OpenAQConnection(ExperimentalBaseConnection[requests.Session]): def __init__(self, *args, **kwargs): super().__init__(*args, **kwargs) self._resource = self._connect(**kwargs) def _connect(self, **kwargs) -> requests.Session: session = requests.Session() return session def cursor(self): return self._resource def query_countries( self, limit=100, page=1, sort="asc", order_by="name", ttl: int = 3600 ): @st.cache_data(ttl=ttl) def _query_countries(limit, page, sort, order_by): params = { "limit": limit, "page": page, "sort": sort, "order_by": order_by, } with self._resource as s: response = s.get("https://api.openaq.org/v2/countries", params=params) return response.json() return _query_countries(limit, page, sort, order_by) def query( self, country_id, limit=1000, page=1, offset=0, sort="desc", radius=1000, order_by="lastUpdated", dumpRaw="false", ttl: int = 3600, ): @st.cache_data(ttl=ttl) def _get_locations_measurements( country_id, limit, page, offset, sort, radius, order_by, dumpRaw ): params = { "limit": limit, "page": page, "offset": offset, "sort": sort, "radius": radius, "order_by": order_by, "dumpRaw": dumpRaw, } if country_id is not None: params["country_id"] = country_id with self._resource as s: response = s.get("https://api.openaq.org/v2/locations", params=params) return response.json() return _get_locations_measurements( country_id, limit, page, offset, sort, radius, order_by, dumpRaw )もちろん、この接続の中で、出力をキャッシュするために@st.cache_data(ttl=ttl)を使用しています。異なるエンドポイントの呼び出しに使用される引数をより理解するためには、対応するAPIドキュメントを参照してください。
可視化関数の作成
可視化には、plotlyライブラリが使用されており、具体的にはgoクラスからのScattermapboxが使用されています。(以下の関数はレイアウトのために非常に大きく、複数のパートに分割することもできますが、ご容赦ください):
import plotly.graph_objects as go
def visualize_variable_on_map(data_dict, variable):
    is_day = is_daytime()
    mapbox_style = "carto-darkmatter" if not is_day else "open-street-map"
    # 複数の場所のデータを保存するためのリストを初期化する
    latitudes = []
    longitudes = []
    values = []
    display_names = []
    last_updated = []
    # 各場所の関連データを抽出するために結果をループする
    for result in data_dict.get("results", []):
        measurements = result.get("parameters", [])
        for measurement in measurements:
            if measurement["parameter"] == variable:
                value = measurement["lastValue"]
                display_name = measurement["displayName"]
                latitude = result["coordinates"]["latitude"]
                longitude = result["coordinates"]["longitude"]
                last_updated_value = result["lastUpdated"]
                latitudes.append(latitude)
                longitudes.append(longitude)
                values.append(value)
                display_names.append(display_name)
                last_updated.append(last_updated_value)
    if not latitudes or not longitudes or not values:
        print(f"{variable}のデータが見つかりませんでした。")
        return create_custom_markdown_card(
            f"選択された国の{variable}のデータが見つかりませんでした。"
        )
    # 可視化を作成する
    fig = go.Figure()
    marker = [
        custom_markers["humidity"]
        if variable == "humidity"
        else custom_markers["others"]
    ]
    # すべての場所を含む単一の散布図マップボックストレースを追加する
    fig.add_trace(
        go.Scattermapbox(
            lat=latitudes,
            lon=longitudes,
            mode="markers+text",
            marker=dict(
                size=20,
                color=values,
                colorscale="Viridis",  # 別のカラースケールも選択できます
                colorbar=dict(title=f"{variable.capitalize()}"),
            ),
            text=[
                f"{marker[0]} {display_name}: {values[i]}<br>最終更新日時: {last_updated[i]}"
                for i, display_name in enumerate(display_names)
            ],
            hoverinfo="text",
        )
    )
    # マップのレイアウトを更新する
    fig.update_layout(
        mapbox=dict(
            style=mapbox_style,  # 希望のマップスタイルを選択する
            zoom=5,  # 必要に応じて初期ズームレベルを調整する
            center=dict(
                lat=sum(latitudes) / len(latitudes),
                lon=sum(longitudes) / len(longitudes),
            ),
        ),
        margin=dict(l=0, r=0, t=0, b=0),
    )
    create_custom_markdown_card(information)
    st.plotly_chart(fig, use_container_width=True)
アプリの作成
以下のコードは「app.py」ファイルに含まれています:
import streamlit as st
from connection import OpenAQConnection
from utils import * # サポート関数を持つカスタムユーティリティスティットル("OpenAQ Connection", layout="wide")
conn = st.experimental_connection("openaq", type=OpenAQConnection)
# もしreadme tomlファイルがある場合
readme = load_config("config_readme.toml")
# Info
st.title("空気品質データ")
with st.expander("このアプリについて", expanded=False):
    st.write(readme["app"]["app_intro"])
    st.write("")
st.write("")
st.sidebar.image(load_image("logo.png"), use_column_width=True)
display_links(readme["links"]["repo"], readme["links"]["other_link"])
with st.spinner("利用可能な国を読み込んでいます..."):
    # 国は最初の2ページに存在する
    countries = []
    for page in [1, 2]:
        try:
            countries_request = conn.query_countries(page=page)["results"]
            countries = countries + countries_request
        except Exception:
            countries_error = True
    transformed_countries = {
        country["name"]: {
            "code": country["code"],
            "parameters": country["parameters"],
            "locations": country["locations"],
            "lastUpdated": country["lastUpdated"],
        }
        for country in countries
    }
    # アプリが初期化されたときにデフォルトのためのグローバルを追加する
    transformed_countries["Global"] = {
        "code": None,
        "parameters": general_parameters,
        "locations": None,
        "lastUpdated": None,
    }
# パラメータ
st.sidebar.title("選択項目")
selected_country = st.sidebar.selectbox(
    "選択したい国を選択してください",
    transformed_countries,
    placeholder="国",
    index=len(transformed_countries) - 1,  # 最後の1つを取得する "Global"
    help=readme["tooltips"]["country"],
)
selected_variable = st.sidebar.selectbox(
    "選択したい変数を選択してください",
    transformed_countries[selected_country]["parameters"],
    placeholder="変数",
    index=1,
    help=readme["tooltips"]["variable"],
)
radius = st.sidebar.slider(
    "半径を選択してください",
    min_value=100,
    max_value=25000,
    step=100,
    value=1000,
    help=readme["tooltips"]["radius"],
)
total_locations = transformed_countries[selected_country]["locations"]
last_time = transformed_countries[selected_country]["lastUpdated"]
information = f"選択した国は{selected_country}です。見つかった場所の総数は{total_locations}で、最終更新は{last_time}です。"
code = transformed_countries[selected_country]["code"]
locations_response = conn.query(code, radius)
st.title("マップ")
visualize_variable_on_map(locations_response, selected_variable)
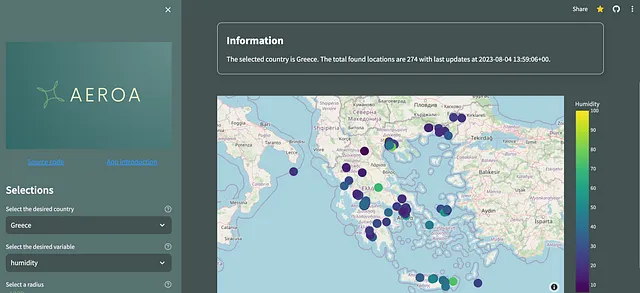
アプリ「streamlit run app.py」を実行した後、アプリが実行されます。

私はこのアプリを「AEROA」と呼び、streamlitコミュニティクラウドで展開されています。また、ソースコードはGithubで見つけることができ、自分の好みに合わせてプレイすることもできます。
結論
このクイックチュートリアルでは、streamlitの新しいst.experimental_connection機能を紹介し、それを使用して大気品質データを提供するオープンAPIとの接続を確立しました。さらに、Plotlyマップで結果を表示する素敵な新しいアプリも開発しました。
We will continue to update VoAGI; if you have any questions or suggestions, please contact us!
Was this article helpful?
93 out of 132 found this helpful
Related articles
- 「あなたのLLMアプリを守る必読です!」
- ファイル管理の効率化:サーバーまたはサーバー上で実行されているDockerコンテナーにおけるファイルの接続と変更をSFTPを使用してSublime Textで行うためのガイド
- lazy_staticを使用してランタイムでRustの定数を初期化する
- 「NVIDIAのCEO、ジェンソン・ホアン氏がSIGGRAPHに戻る」
- AIによる写真の向上:HDアップスケーリングからカートゥーンフィルターまで
- 「15Rockの共同創業者兼CEO、ガウタム・バクシ氏によるインタビューシリーズ」
- PythonでのZeroからAdvancedなPromptエンジニアリングをLangchainで


