PlotlyとPandas:効果的なデータ可視化のための力の結集
PlotlyとPandas:データ可視化の効果的な力結集
Storytelling with Dataを参考にしたクイックガイド
「私のデータ可視化のスキルはひどいです。私の仕事に対してオーディエンスは感心していないし、さらに悪いことに納得していない。」
かつて多くの人々がこの問題に直面しました。天才であるか、デザインのコースを受けたことがない限り、視覚的に美しいチャートを作成し、同時にオーディエンスに直感的に理解されるものにすることはかなり難しく、時間がかかることがあります。
当時私が考えたのは、チャートを作成する際に情報をオーディエンスに直感的に伝えるためにより意図的になりたいということです。それは、何が起こっているのかを理解するために彼らの脳力を消費し、時間を浪費する必要がないということです。
私は以前、MatplotlibからSeaborn、最終的にPlotlyに切り替えれば、美的な懸念事項が解決すると思っていました。実際には、私は間違っていました。可視化は単純に美的な側面だけではありません。以下に、私のアプローチを変えるために本当にインスピレーションを受けたCole Nussbaumer Knaflic氏の「Storytelling with Data」¹から再現しようとした2つの可視化があります。それらは清潔でエレガントで目的を持っています。この記事ではこれらのチャートを再現しようとします!
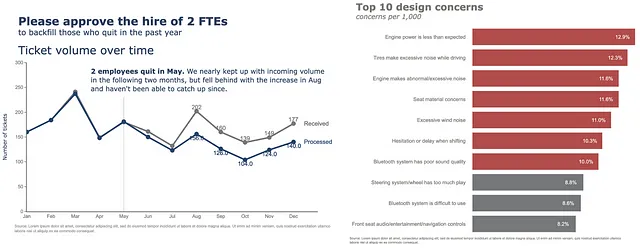
この投稿の要点は次のとおりです。優れた可視化の背後にある概念の詳細な説明を探している場合は、Storytelling with Data¹をチェックしてください。各ページは貴重な情報です。ツールに特化した実践的なアドバイスを探している場合は、正しい場所にいます。Coleは彼女の本の冒頭で、彼女が提示したアドバイスは普遍的でツールに依存しないものであると述べていますが、彼女は本の例をExcelを使用して作成したことを認めています。私を含めた一部の人々は、多くの理由からExcelやドラッグアンドドロップのツールが好きではありません。Python、R、および他のいくつかのプログラミング言語を使用して可視化を作成することを好む人もいます。あなたがこのセグメントの一部であり、Pythonを主なツールとして使用している場合、この記事はあなたのためです。
目次
- Chaining—Pandas Plot
- 水平バーチャート
- 折れ線グラフ
- ボーナス: 数字チャート
Chaining—Pandas Plot
もしあなたがデータ整形でPandasを使う上級者または経験豊富なプレーヤーであれば、おそらく「Chaining」というアイデアに遭遇したり、採用したりすることがあるかもしれません。簡単に言えば、チェーンを使うことでコードがより読みやすく、デバッグしやすく、本番用意になります。以下に、私が言及していることのアイデアをつかむために、一行ずつ読む必要はありません。各ステップは明確で説明しやすく、コードは不要な中間変数がない状態で整理されています。
(epl_10seasons .rename(columns=lambda df_: df_.strip()) .rename(columns=lambda df_: re.sub('\W+|[!,*)@#%(&$_?.^]', '_', df_)) .pipe(lambda df_: df_.astype({column: 'int8' for column in (df_.select_dtypes("integer").columns.tolist())})) .pipe(lambda df_: df_.astype({column: 'category' for column in (df_.select_dtypes("object").columns.tolist()[:-1])})) .assign(match_date=lambda df_: pd.to_datetime(df_.match_date, infer_datetime_format=True)) .assign(home_team=lambda df_: np.where((df_.home_team == "Arsenal"), "The Gunners", df_.home_team), away_team=lambda df_: np.where((df_.away_team == "Arsenal"), "The Gunners", df_.away_team), month=lambda df_: df_.match_date.dt.month_name()) .query('home_team == "The Gunners"'))これは素晴らしいですが、可視化チャートの作成においても、チェーンプロセスを続けることができることを知っていましたか? Pandas Plotは、デフォルトでMatplotlibバックエンドを使用しています。それでは、どのように機能し、Coleが彼女の本で作成したいくつかの例を再現しましょう。
import pandas as pd
import numpy as np
import matplotlib.pyplot as plt
import seaborn as sns
import plotly.graph_objects as go

%matplotlib inline
pd.options.plotting.backend = 'plotly'

df = pd.DataFrame({"concerns": ["エンジンの出力が予想よりも低い",
                                "タイヤが運転中に異常な騒音を発する",
                                "エンジンが異常な騒音を発する",
                                "シート素材に問題がある",
                                "異常な風切り音",
                                "シフト時のためらいや遅延",
                                "Bluetoothシステムの音質が悪い",
                                "ステアリングシステム/ホイールに遊びが多すぎる",
                                "Bluetoothシステムの使用が難しい",
                                "フロントシートのオーディオ/エンターテイメント/ナビゲーションコントロール"
                                ],
                  "1,000件当たりの問題数": [12.9, 12.3, 11.6, 11.6, 11.0, 10.3, 10.0, 8.8, 8.6, 8.2]},
                  index=list(range(0,10,1)))
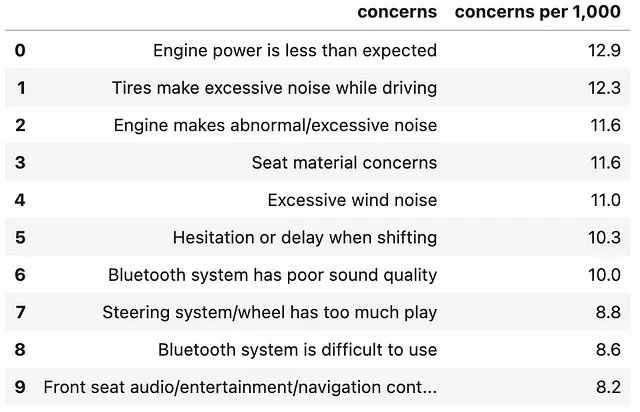
次のようなDataFrameがあります。
(df .plot .barh())これは基本的な可視化チャートを生成する最も速い方法です。DataFrameから直接.plot属性と.lineメソッドをチェーンすることで、以下のプロットを得ることができます。

もし上記のプロットが見た目のチェックをパスしていないと思った場合は、反応や判断を保留してください。実際には少なくとも見た目は醜いです。それでは、これを改善してみましょう。以下のトリックを使って、PandasのプロットバックエンドをMatplotlibからPlotlyに切り替えます。
pd.options.plotting.backend = 'plotly'「なぜPlotlyに変更するのですか?Matplotlibでも同じことができるのではないですか?」と疑問に思うかもしれません。それでは、違いを見てみましょう。
PandasでMatplotlibバックエンドを使用すると、Axesオブジェクトが返されます。組み込みのtype()メソッドを使用して自分で確認してみてください。これは素晴らしいことです。なぜなら、Axesオブジェクトを使用すると、チャートをさらに修正するためのメソッドにアクセスできるからです。Axesオブジェクトで実行できる可能性のあるメソッドについては、このドキュメント²をチェックしてください。早速、いくつかの例を見てみましょう。
(df .plot .barh() .set_xlabel("1,000件当たりの問題数"))
x軸のラベルを「1,000件当たりの問題数」に設定することができましたが、それによりTextオブジェクトが返され、チャートをさらに修正するための貴重なAxisオブジェクトにアクセスすることができなくなりました。残念ですね!
上記の制限を回避するための代替案があります。
(df .plot .barh(xlabel="1,000件当たりの問題数", ylabel="問題", title="上位10の設計上の懸念事項"))
ただし、Pandasの実装により統合が制限されているため、詳細な修正はできません。
一方、PlotlyはAxesオブジェクトを返しません。代わりにgo.Figureオブジェクトが返されます。ここでの違いは、チャートの更新を担当するメソッドもgo.Figureオブジェクトを返すことです。これにより、チャートをさらに更新するためにメソッドをチェーンすることができます。試してみましょう!
ちなみに、下記のメソッドと引数の組み合わせをどのように取得しているか気になる場合は、公式ドキュメントこちら³を参照してください。
以下は、始めるための重要なメソッドです – .update_traces, .add_traces, .update_layout, .update_xaxes, .update_yaxes, .add_annotation, .update_annotations.
水平棒グラフ
以下の可視化のために、いくつかの重要なカラーパレットを定義しましょう。
GRAY1, GRAY2, GRAY3 = '#231F20', '#414040', '#555655'GRAY4, GRAY5, GRAY6 = '#646369', '#76787B', '#828282'GRAY7, GRAY8, GRAY9, GRAY10 = '#929497', '#A6A6A5', '#BFBEBE', '#FFFFFF'BLUE1, BLUE2, BLUE3, BLUE4, BLUE5 = '#25436C', '#174A7E', '#4A81BF', '#94B2D7', '#94AFC5'BLUE6, BLUE7 = '#92CDDD', '#2E869D'RED1, RED2, RED3 = '#B14D4A', '#C3514E', '#E6BAB7'GREEN1, GREEN2 = '#0C8040', '#9ABB59'ORANGE1, ORANGE2, ORANGE3 = '#F36721', '#F79747', '#FAC090'gray_palette = [GRAY1, GRAY2, GRAY3, GRAY4, GRAY5, GRAY6, GRAY7, GRAY8, GRAY9, GRAY10]blue_palette = [BLUE1, BLUE2, BLUE3, BLUE4, BLUE5, BLUE6, BLUE7]red_palette = [RED1, RED2, RED3]green_palette = [GREEN1, GREEN2]orange_palette = [ORANGE1, ORANGE2, ORANGE3]sns.set_style("darkgrid")sns.set_palette(gray_palette)sns.palplot(sns.color_palette())
ここでは、10パーセント以上の関心事を別の色で強調表示したいと思います。
color = np.array(['rgb(255,255,255)']*df.shape[0])color[df .set_index("concerns", drop=True) .iloc[::-1] ["concerns per 1,000"]>=10] = red_palette[0]color[df .set_index("concerns", drop=True) .iloc[::-1] ["concerns per 1,000"]<10] = gray_palette[4]次に、DataFrameからプロットを作成します。
(df .set_index("concerns", drop=True) .iloc[::-1] .plot .barh() .update_traces(marker=dict(color=color.tolist())))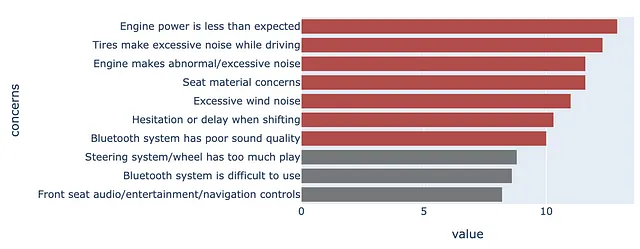
レイアウトを更新すると、以下のようになります。ここでは、テンプレートを指定し、プロットにタイトルと余白を追加し、図オブジェクトのサイズを指定します。注釈については、一時的にコメントアウトします。
(df .set_index("concerns", drop=True) .iloc[::-1] .plot .barh() .update_traces(marker=dict(color=color.tolist())) .update_layout(template="plotly_white", title=dict(text="<b>Top 10 design concerns</b> <br><sup><i>concerns per 1,000</i></sup>", font_size=30, font_color=gray_palette[4]), margin=dict(l=50, r=50, b=50, t=100, pad=20), width=1000, height=800, showlegend=False, #annotations=annotations ))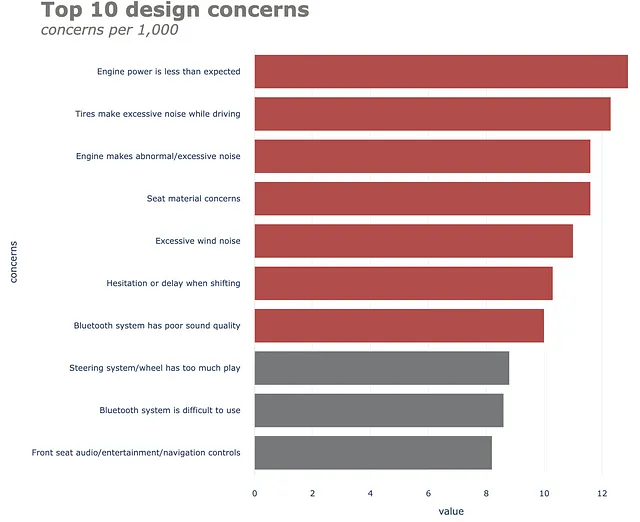
x軸とy軸の更新プロパティは以下のようになります。
(df .set_index("concerns", drop=True) .iloc[::-1] .plot .barh() .update_traces(marker=dict(color=color.tolist())) .update_layout(template="plotly_white", title=dict(text="<b>トップ10のデザインの懸念事項</b> <br><sup><i>1,000件あたりの懸念事項</i></sup>", font_size=30, font_color=gray_palette[4]), margin=dict(l=50, r=50, b=50, t=100, pad=20), width=1000, height=800, showlegend=False, #annotations=annotations ) .update_xaxes(title_standoff=10, showgrid=False, visible=False, tickfont=dict( family='Arial', size=16, color=gray_palette[4],), title="") .update_yaxes(title_standoff=10, tickfont=dict( family='Arial', size=16, color=gray_palette[4],), title=""))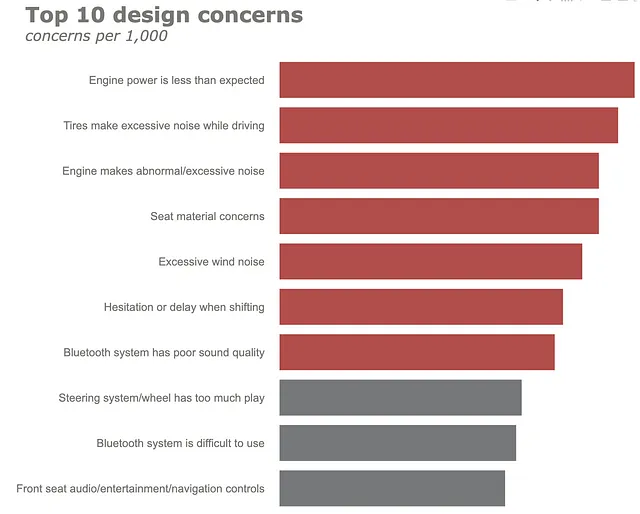
最後に、チャートに注釈を追加します。ここでは、いくつかの注釈があります – 水平バーチャートと脚注にデータラベルを追加します。一緒にやりましょう。まず、注釈を別のセルで定義します。
annotations = []y_s = np.round(df["concerns per 1,000"], decimals=2)# データラベルの追加for yd, xd in zip(y_s, df.concerns):    # バーネットワースのラベル付け    annotations.append(dict(xref='x1',                             yref='y1',                            y=xd, x=yd - 1,                            text=str(yd) + '%',                            font=dict(family='Arial', size=16,                                      color=gray_palette[-1]),                            showarrow=False))    # ソースの注釈annotations.append(dict(xref='paper',                         yref='paper',                        x=-0.72,                         y=-0.050,                        text='ソース:Lorem ipsum dolor sit amet, consectetur adipiscing elit, sed do eiusmod tempor incididunt ut labore et dolore magna aliqua. Ut enim ad minim veniam, quis nostrud exercitation ullamco'                             '<br>laboris nisi ut aliquip ex ea commodo consequat.',                        font=dict(family='Arial', size=10, color=gray_palette[4]),                        showarrow=False,                        align='left'))

(df .set_index("concerns", drop=True) .iloc[::-1] .plot .barh() .update_traces(marker=dict(color=color.tolist())) .update_layout(template="plotly_white",                title=dict(text="<b>トップ10のデザインの懸念事項</b> <br><sup><i>1,000件あたりの懸念事項</i></sup>",                            font_size=30,                           font_color=gray_palette[4]),                margin=dict(l=50,                            r=50,                            b=50,                            t=100,                            pad=20),                width=1000,                 height=800,                 showlegend=False,                 annotations=annotations               ) .update_xaxes(title_standoff=10,               showgrid=False,               visible=False,               tickfont=dict(                        family='Arial',                        size=16,                        color=gray_palette[4],),               title="") .update_yaxes(title_standoff=10,               tickfont=dict(                        family='Arial',                        size=16,                        color=gray_palette[4],),               title=""))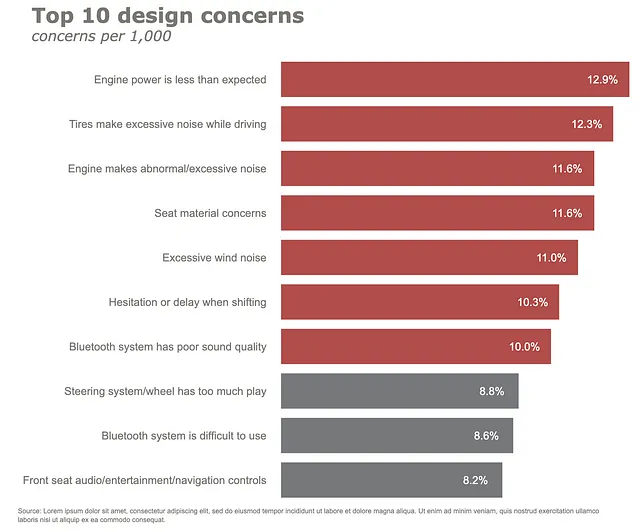
初期のデフォルトバージョンと比べて、これははるかに良いグラフですよね?では、別の人気のあるグラフ、折れ線グラフを探求してみましょう。
以下の例は、上記の例よりも複雑ですが、アイデアは同じです。
折れ線グラフ
折れ線グラフのためのデフォルトのMatplotlibプロットバックエンドを簡単に見てみましょう。
pd.options.plotting.backend = 'matplotlib'df = pd.DataFrame({"Received": [160,184,241,149,180,161,132,202,160,139,149,177], "Processed":[160,184,237,148,181,150,123,156,126,104,124,140]}, index=['Jan', 'Feb', 'Mar', 'Apr', 'May', 'Jun', 'Jul', 'Aug', 'Sep', 'Oct', 'Nov', 'Dec'])(df .plot .line());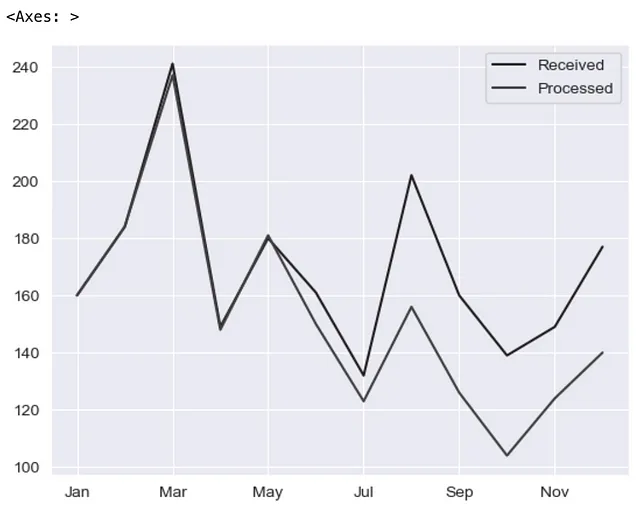
プロットバックエンドをPlotlyに切り替えましょう!
pd.options.plotting.backend = 'plotly'(df .plot(x=df.index, y=df.Received, labels=dict(index="", value="チケットの数"),))PandasのプロットバックエンドをPlotlyに切り替えた後、上記のコードは以下の結果を得ます。ここでは、Receivedシリーズのみをプロットしています。

上記の方法をさらに連鎖させて、lineプロパティを更新してみましょう。ここでは、色、太さを変更し、データポイントにマーカーを配置します。
(df .plot(x=df.index, y=df.Received, labels=dict(index="", value="チケットの数"),) .update_traces(go.Scatter(mode='lines+markers+text', line={"color": gray_palette[4], "width":4}, marker=dict(size=12)),))
チャートにProcessedシリーズを追加しましょう!
(df .plot(x=df.index, y=df.Received, labels=dict(index="", value="チケットの数"),) .update_traces(go.Scatter(mode='lines+markers+text', line={"color": gray_palette[4], "width":4}, marker=dict(size=12)),) .add_traces(go.Scatter(x=df.index, #Processed列を追加 y=df.Processed, mode="lines+markers+text", line={"color": blue_palette[0], "width":4}, marker=dict(size=12))))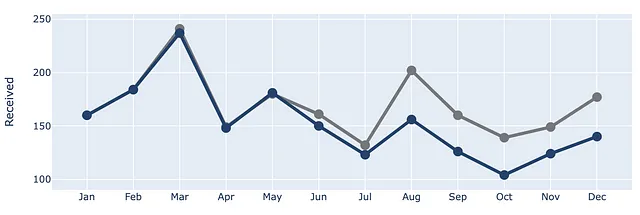
2つの線が分岐するポイントを示すために、インデックスがMayの位置に垂直線を追加しましょう。
(df .plot(x=df.index, y=df.Received, labels=dict(index="", value="チケットの数"),) .update_traces(go.Scatter(mode='lines+markers+text', line={"color": gray_palette[4], "width":4}, marker=dict(size=12)),) .add_traces(go.Scatter(x=df.index, #Processed列を追加 y=df.Processed, mode="lines+markers+text", line={"color": blue_palette[0], "width":4}, marker=dict(size=12))) .add_traces(go.Scatter(x=["May", "May"], #垂直線を追加 y=[0,230], fill="toself", mode="lines", line_width=0.5, line_color= gray_palette[4])))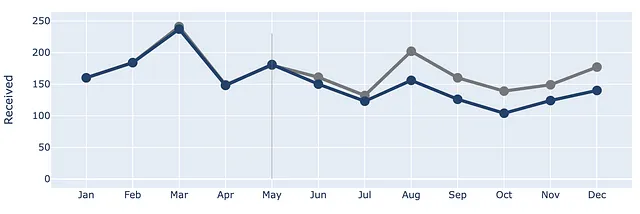
次に、背景を白に変更し、タイトル、マージン、およびその他の要素を追加して、全体のレイアウトを更新します。注釈については、一時的にコメントアウトします。
(df .plot(x=df.index, y=df.Received, labels=dict(index="", value="チケットの数"),) .update_traces(go.Scatter(mode='lines+markers+text', line={"color": gray_palette[4], "width":4}, marker=dict(size=12)),) .add_traces(go.Scatter(x=df.index, #処理済みの列を追加 y=df.Processed, mode="lines+markers+text", line={"color": blue_palette[0], "width":4}, marker=dict(size=12))) .add_traces(go.Scatter(x=["5月", "5月"], #垂直線を追加 y=[0,230], fill="toself", mode="lines", line_width=0.5, line_color= gray_palette[4])) .update_layout(template="plotly_white", title=dict(text="<b>2人のFTEの雇用承認をお願いします</b> <br><sup>過去1年間に退職した人員の補充</sup> <br>時間経過に伴うチケットの数量 <br><br><br>", font_size=30,), margin=dict(l=50, r=50, b=100, t=200,), width=900, height=700, yaxis_range=[0, 300], showlegend=False, #annotations=right_annotations, ))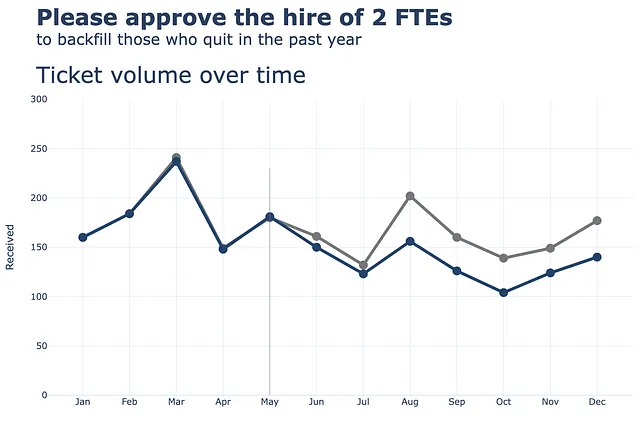
次に、x軸とy軸の両方を更新します。
(df .plot(x=df.index, y=df.Received, labels=dict(index="", value="チケットの数"),) .update_traces(go.Scatter(mode='lines+markers+text', line={"color": gray_palette[4], "width":4}, marker=dict(size=12)),) .add_traces(go.Scatter(x=df.index, #処理済みの列を追加 y=df.Processed, mode="lines+markers+text", line={"color": blue_palette[0], "width":4}, marker=dict(size=12))) .add_traces(go.Scatter(x=["5月", "5月"], #垂直線を追加 y=[0,230], fill="toself", mode="lines", line_width=0.5, line_color= gray_palette[4])) .update_layout(template="plotly_white", title=dict(text="<b>2人のFTEの雇用承認をお願いします</b> <br><sup>過去1年間に退職した人員の補充</sup> <br>時間経過に伴うチケットの数量 <br><br><br>", font_size=30,), margin=dict(l=50, r=50, b=100, t=200,), width=900, height=700, yaxis_range=[0, 300], showlegend=False, #annotations=right_annotations, ) .update_xaxes(dict(range=[0, 12], showline=True, showgrid=False, linecolor=gray_palette[4], linewidth=2, ticks='', tickfont=dict( family='Arial', size=13, color=gray_palette[4], ), )) .update_yaxes(dict(showline=True, showticklabels=True, showgrid=False, ticks='outside', linecolor=gray_palette[4], linewidth=2, tickfont=dict( family='Arial', size=13, color=gray_palette[4], ), title_text="チケットの数" )))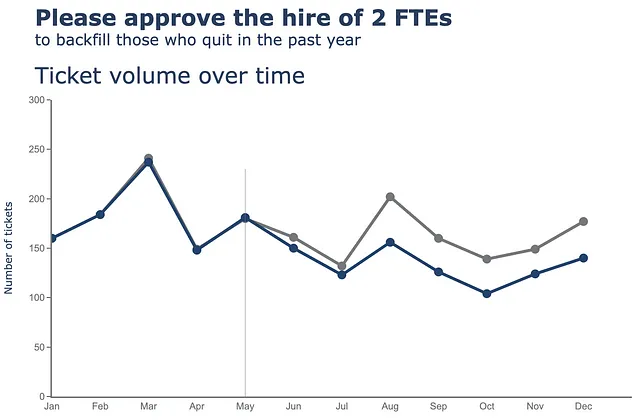
最後に、チャートにいくつかの注釈を追加します。ここでは、いくつかの注釈があります。ラインチャート(Received、Processed)にラベルを追加するだけでなく、散布点にもラベルを追加します。これは少し複雑かもしれませんが、一緒にやってみましょう。まず、注釈を別のセルで定義します。
y_data = df.to_numpy()colors = [gray_palette[3], blue_palette[0]]labels = df.columns.to_list()right_annotations = []# ラインにラベルを追加するための注釈for y_trace, label, color in zip(y_data[-1], labels, colors): right_annotations.append(dict(xref='paper', x=0.95, y=y_trace, xanchor='left', yanchor='middle', text=label, font=dict(family='Arial',size=16,color=color), showarrow=False))# 散布点にラベルを追加するための注釈scatter_annotations = []y_received = [each for each in df.Received]y_processed = [float(each) for each in df.Processed]x_index = [each for each in df.index]y_r = np.round(y_received)y_p = np.rint(y_processed)for ydn, yd, xd in zip(y_r[-5:], y_p[-5:], x_index[-5:]): scatter_annotations.append(dict(xref='x2 domain', yref='y2 domain', y=ydn, x=xd, text='{:,}'.format(ydn), font=dict(family='Arial',size=16,color=gray_palette[4]), showarrow=False, xanchor='center', yanchor='bottom', )) scatter_annotations.append(dict(xref='x2 domain', yref='y2 domain', y=yd, x=xd, text='{:,}'.format(yd), font=dict(family='Arial',size=16,color=blue_palette[0]), showarrow=False, xanchor='center', yanchor='top', ))注釈を定義した後は、次のように注釈変数をチェーンメソッドの中に配置するだけです。
(df .plot(x=df.index, y=df.Received, labels=dict(index="", value="チケットの数"),) .update_traces(go.Scatter(mode='lines+markers+text', line={"color": gray_palette[4], "width":4}, marker=dict(size=12)),) .add_traces(go.Scatter(x=df.index, #Processed列を追加 y=df.Processed, mode="lines+markers+text", line={"color": blue_palette[0], "width":4}, marker=dict(size=12))) .add_traces(go.Scatter(x=["May", "May"], #垂直線を追加 y=[0,230], fill="toself", mode="lines", line_width=0.5, line_color= gray_palette[4])) .update_layout(template="plotly_white", title=dict(text="<b>2人のFTEの採用を承認してください。</b> <br><sup>過去1年間に辞めた人たちの補充</sup> <br>時間経過に伴うチケットの数 <br><br><br>", font_size=30,), margin=dict(l=50, r=50, b=100, t=200,), width=900, height=700, yaxis_range=[0, 300], showlegend=False, annotations=right_annotations, ) .update_layout(annotations=scatter_annotations * 2) .update_xaxes(dict(range=[0, 12], showline=True, showgrid=False, linecolor=gray_palette[4], linewidth=2, ticks='', tickfont=dict( family='Arial', size=13, color=gray_palette[4], ), )) .update_yaxes(dict(showline=True, showticklabels=True, showgrid=False, ticks='outside', linecolor=gray_palette[4], linewidth=2, tickfont=dict( family='Arial', size=13, color=gray_palette[4], ), title_text="チケットの数" )) .add_annotation(dict(text="<b>5月に2人の従業員が辞めました。</b> 後続の2ヶ月間で入荷量にほぼ追いつきましたが、8月の増加に遅れをとり、以降追いつくことができませんでした。", font_size=18, align="left", x=7.5, y=265, showarrow=False)) .add_annotation(dict(xref='paper', yref='paper', x=0.5, y=-0.15, text='出典:Lorem ipsum dolor sit amet, consectetur adipiscing elit, sed do eiusmod tempor incididunt ut labore et dolore magna aliqua. Ut enim ad minim veniam, quis nostrud exercitation ullamco' '<br>laboris nisi ut aliquip ex ea commodo consequat.', font=dict(family='Arial', size=10, color='rgb(150,150,150)'), showarrow=False, align='left')) .update_annotations(yshift=0) .show())
ボーナス:数字のチャート
記事のこの部分に到達したことおめでとうございます!ここでは、数字を視覚的に表示するための追加のプロットを提供します。要するに、私が言及しているのはこれです。

これはDataFrameの結果ではないため、空のgo.Figureオブジェクトを作成し、注釈を徐々に追加していきます。最後にレイアウトを更新します。
(go .Figure() # 空のフィギュアを作成 .add_annotation( x=0.0, y=1, text='パイロットプログラムは成功でした', showarrow=False, font={'size': 36, 'color': 'white'}, bgcolor=gray_palette[-3], bordercolor='gray', borderwidth=0, xref='paper', yref='paper', xanchor='left', yanchor='top', align='left', ax=0, ay=-10 ) .add_annotation( x=-1.0, # テキスト位置のX座標 y=3.0, # テキスト位置のY座標 text="パイロットプログラムの後,", # テキスト内容 showarrow=False, # 矢印を非表示 font=dict(size=20, color=blue_palette[1]), # フォントサイズをカスタマイズ xanchor='left', yanchor='top', align='left', ) .add_annotation( x=-1.0, # テキスト位置のX座標 y=1.6, # テキスト位置のY座標 text="<b>68%</b>", # テキスト内容 showarrow=False, # 矢印を非表示 font=dict(size=160, color=blue_palette[1]), # フォントサイズをカスタマイズ xanchor='left', align='left', ) .add_annotation( x=-1.0, # テキスト位置のX座標 y=0.2, # テキスト位置のY座標 text="<b>子供たちの68%が科学に興味を持ちました</b>", # テキスト内容 showarrow=False, # 矢印を非表示 font=dict(size=20, color=blue_palette[1]), # フォントサイズをカスタマイズ xanchor='left', align='left', ) .add_annotation( x=-1.0, # テキスト位置のX座標 y=-0.2, # テキスト位置のY座標 text="プログラムに参加する前の44%と比較して。", # テキスト内容 showarrow=False, # 矢印を非表示 font=dict(size=20, color=gray_palette[-3]), # フォントサイズをカスタマイズ xanchor='left', align='left', ) .add_annotation( x=-1.0, # テキスト位置のX座標 y=-0.7, # テキスト位置のY座標 text='パイロットプログラムの前後で実施された100人の学生の調査に基づく' '(両方の調査で100%の回答率)。', # テキスト内容 showarrow=False, # 矢印を非表示 font=dict(size=10.5, color=gray_palette[-3]), # フォントサイズをカスタマイズ xanchor='left', align='left', ) .update_layout( xaxis=dict(visible=False), # x軸を非表示 yaxis=dict(visible=False), # y軸を非表示 margin=dict(l=0, r=0, b=0, t=0, pad=0), font=dict(size=26, color=gray_palette[-3]), # フォントサイズをカスタマイズ paper_bgcolor='rgba(0,0,0,0)', plot_bgcolor='rgba(0,0,0,0)' ) .show())あとがき
ここまでです!重要なのは、望ましい結果を得るまで、プロットをステップバイステップで更新し磨くことです。もちろん、すべてのテクニックにはそれぞれの限界があります。もしチャートがあまりにも複雑になってしまい、作成が困難な場合は、Plotly Expressを参照するか、Plotly Graph Objectsを使用してすべてをゼロから構築することも有益です。最初はこのテクニックを取り入れることが難しく不慣れに感じるかもしれませんが、練習を続ければすぐに意味のある美しい可視化を作成できるようになります!
もし本記事から何か役立つ情報を得た場合は、VoAGIでフォローしてください。毎週1記事で自分自身を最新の情報に更新し、一歩先を行くことができます!
私とつながる!
- LinkedIn 👔
- Twitter 🖊
参考文献
- Storytelling with Data by Cole Nussbaumer Knaflic. https://www.storytellingwithdata.com/books
- Matplotlib Axes API. https://matplotlib.org/stable/api/axes_api.html
- Plotly Graphing Libraries. https://plotly.com/python/reference/
We will continue to update VoAGI; if you have any questions or suggestions, please contact us!
Was this article helpful?
93 out of 132 found this helpful
Related articles
